Year 6 SATs Results:
Please click to view the 2024-25
SATs results and comparative data
Please click to view the 2023-24
SATs results and comparative data
Please click to view the 2022-23
SATs results and comparative data

To visit The Department of Education School Performance Tables, please use the following links:
1. Wreningham VC Primary Performance Page
2. General DFE School Performance Tables Website
![]()
Note: No SATs data was published for the years 2020, 2021 and 2022 due to the covid pandemic.
Note: A one-off writing test is no longer included in the SATs
Writing levels are determined over the year through teacher assessment.
Note: Results are now published in the form of a standardised score. In general terms, 100 being the 'expected' standard, below 100 classed as below/working towards standard and greater than 109 denoting working at a higher level.
SATs Results from Previous Years:
Please note that no SATs data was published by the DFE for the years 2020, 2021 and 2022
2021-22 KS2 - Year 6 SATs Results:
KS2 - Year 6 SATs Results A cohort of 11 year 6 children (2 of which did not sit the SATs tests in Maths and Reading). Red results denote results including these two children. |
2021-22 |
| % of children who took the test,meeting the expected standard or above in reading, writing and maths (combined). i.e. if a child fails to meet the standard in one of the three subjects, they will not contribute to the %. | 91% 73% |
| Average progress in Reading - Average | No data published |
| % of children who took the test achieving expected standard in Reading | 100%
82% |
| Average progress in Writing - Average | No data published |
| % of children achieving expected standard in Writing (all children in cohort teacher assessed) | 82%
|
| Average progress in Maths - Average | No data published |
| % of children achieving expected standard in Maths | 89%
73% |
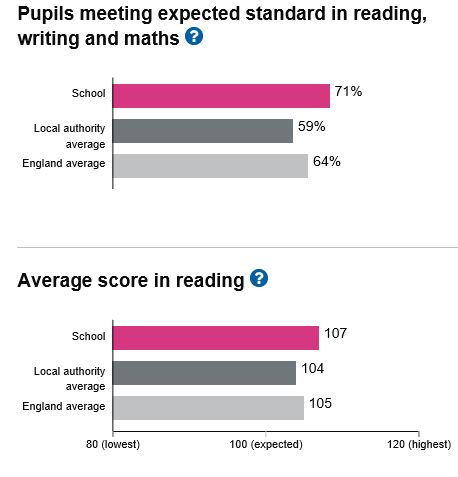
| Average scaled score in Reading | 107 |
| Average scaled score in Maths | 105 |
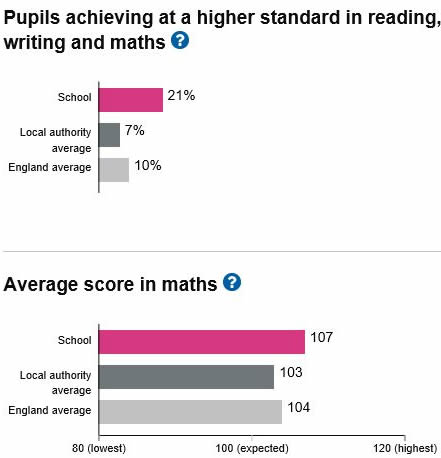
| % of childrenachieving a high level of attainment in Reading, Writing and Maths (Combined) - i.e. pupils attaining beyond the expected standard score of 100 and scoring greater than 109 in all 3 subjects. | 18% |
Number of children in cohort |
11 |
No SATs tests took place in the years
2020 and 2021 due to Covid.
2019 KS2 - Year 6 SATs Results:
| KS2 - Year 6 SATs Results | 2018-19 |
| % of children meeting the expected standard or above in reading, writing and maths (combined). i.e. if a child fails to meet the standard in one of the three subjects, they will not contribute to the %. | 87.5%
|
| Average progress in Reading - Average | -1.6 |
| % of children achieving expected standard in Reading | 87.5% |
| Average progress in Writing - Average | 1.13 |
| % of children achieving expected standard in Writing | 87.5% |
| Average progress in Maths - Average | -0.79 |
| % of children achieving expected standard in Maths | 87.5% |
| Average scaled score in Reading | 107 |
| Average scaled score in Maths | 108 |
| % of children achieving a high level of attainment in Reading, Writing and Maths (Combined) - i.e pupils attaining beyond the expected standard score of 100 and scoring greater than 109 in all 3 subjects. | 25% |
Number of children in cohort |
16 |
2018 KS2 - Year 6 SATs Results:
|
Previous Years' KS2 - Year 6
SATs Results:
|
|
|
|
| KS2 - Year 6 SATs Results | 2012-13 |
| % of children achieving Level 4 or above in Reading, Writing & Maths; | 100% |
| % of children achieving Level 5 or above in Reading, Writing & Maths; | 46% |
| % of children achieving Level 4 or above in Maths; | 100% |
| % of children achieving Level 5 or above in Maths; | 85% |
| % of children achieving Level 6 in Maths; | 23% |
| % of children achieving Level 4 or above in Reading; | 100% |
| % of children achieving Level 5 or above in Reading; | 69% |
| % of children achieving Level 4 or above in new Grammar, Punctuation and Spelling Test; | 92% |
| % of children achieving Level 5 or above in new Grammar, Punctuation and Spelling Test; | 77% |
Total number of children in cohort |
13 |
| KS2 - Year 6 SATs Results | 2011-12 |
| % of children achieving Level 4 or above in English and Maths; | 87% |
% of children making expected progress (i.e. 2 levels), in English; |
100% |
% of children making expected progress (i.e. 2 levels), in Maths; |
93% |
| % of children achieving Level 5 or above English; | 47% |
| % of children achieving Level 5 or above in Maths; | 53% |
| Total number of children in cohort | 15 |